


Time Series Analysis: Stock Price Forecasting with Classical Time Series to Deep Learning Method
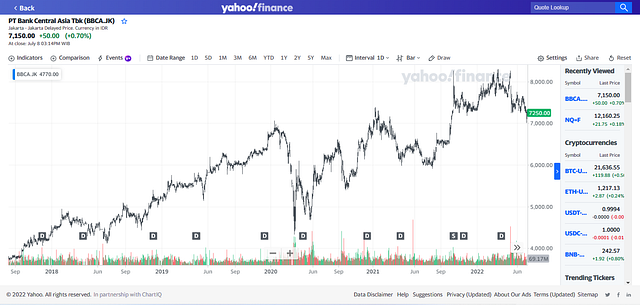
Time Series is everywhere and we often meet. You may be able to see that in the data on the number of airplane passengers, weather predictions, stock price…